


KNOWLEDGE AND QUALITY OF INSURANCE SERVICES – PRACTICAL APPROACH (SECOND PART)
Jarosław Wenancjusz Przybytniowski Ph.D
Institute of Management
The Jan Kochanowski University in Kielce,
ul. Uniwersytecka 21, 25-406 Kielce, Poland,
email: j.w.przybytniowski@wp.pl; ORCID: 0000-0001-6164-2953
Łukasz Wróbel Ph.D
Dean of the Branch of the Social Academy of Sciences in Kielce,
Kielce Business Center,
Al. Solidarności 34, 25-323 Kielce, 5th floor, room 505, Poland,
e-mail: lukaszwrobel.ilza@gmail.com; ORCID: 0000-0002-5715-6239
Abstract
The primary aim of this paper is to study and thoroughly analyse the assessment of customer satisfaction with the provided insurance service quality using the Servqual method in practical terms.
The study is the second part of the study with a similar title, where the authors introduced the essence of knowledge in insurance. Based on the above aim, the Authors adopted the thesis that knowledge and, what follows, the awareness of the knowledge possessed, are important elements mutually influencing the increase in service quality provided in the insurance sector. In the article the Authors and conducted the analysis of statistical data on a selected group of respondents in the area of England (UK) and Poland in the years 2022-2023.
The article is a continuation of research related to improving the quality of voluntary insurance service, presented in publications [Przybytniowski, 2010-2023].
Key words: knowledge, customer awareness, Insurance service quality
Introduction
The second part of the study is devoted to the empirical analysis of the examined issue. The development of knowledge awareness among customers has an impact not only on the ability to use and shape it properly, but to a large extent contributes to the improvement of service quality provision. Service quality is one of the fundamental guarantees of implementing positive solutions which fosters appropriate relations with customers [Brandt, 1987, pp. 61-65; Kant, Jaiswal, 2017, pp. 411-430; Boonlertvanich, 2019, pp. 278-302]. Satisfaction with the quality of provided services contributes to the growth in customer loyalty [Alnaser, Abd Ghani, Rahi, 2018, pp. 63-72], by fulfilling their expectations, which improves the image of an organisation. The degree of conscious use of knowledge in quality processes has a considerable impact on achieving a high competitive position of the company [Porter, 1990], thus, contributing to the acquisition of trust among customers. This process needs constant improvement, learning about the changing needs and requirements of customers, as well as conducting current insurance market analyses [Anand, Ward, Tatikonda, Schilling, 2009, pp. 444-461; Przybytniowski, 2019, pp. 105-110; 2022, pp, 71-136; 2023, pp. 57-108]. Such an approach guarantees conscious actions of customers, which influences the success or the failure of an organisation. This aspect has been subjected to empirical research, where the essence is to study and analyse the assessment of customer satisfaction with the quality of services provided in the insurance sector, using the Servqual method. The article uses the results of the statistical survey on a selected group of customers using the service offer of insurance institutions on the territory of UK and Poland in the years 2022-2023.
1. Methodology
The methodology part of this paper is devoted to the research and analysis of the assessment of insurance service quality using the Servqual method. The Servqual method is used to examine the level of service quality and customer expectations, and their sensitivity to change while providing a certain service. It is used as a universal measure in the examination of quality of all kinds of services. The application of Servqual method lets us know customer expectations and examine the gap between what a customer expects and what a customer is given by a service provider [Hamrol, Mantura, 2008, pp. 92-93]. The purpose of the research is to analyse the relation between the buyer’s expectations and mental representations, and the way the service is perceived by the buyer, bearing in mind the optimal level of possessed knowledge and awareness, using five Servqual factors (areas). In order to reach the assumed aim and achieve objective research results, the Authors uses the results of statistical data and the literature, which allows to adopt definite factors (areas) in the service quality assessment by means of the Servqual method. In order to establish the attributes of insurance service quality and express the opinion on the analysed issue, a questionnaire survey was conducted among individual customers using the services of insurance institutions in UK and Poland from October to December in the years 2022-2023. The survey was conducted by insurance agents being in direct and indirect contact with customers of an insurance institution. Customers of insurance institutions were supposed to present their subjective opinion on the service offered to them. Moreover, they presented their opinions in two areas: the service expected and the assessment of the service experienced. By means of the Servqual method the level of customer knowledge and satisfaction was examined, with the use of services provided by insurance institutions in the two countries: Poland and England. In order to determine the assessment of importance of five attributes of quality (service tangibility, reliability, empathy, professionalism and confidence, and the reaction to customer expectations), the Authors applied a 6-point scale, where: 1 – represents a very unsatisfactory level to the respondent, and 6 – represents a very satisfactory level to the respondent . The assessment of insurance service quality was to calculate the difference between customer expectations and the service perception. It allowed the Authors to find the gap between these values and to indicate the areas in which it is necessary to introduce additional changes and remedial actions. The analysis of the research results was divided into three stages:
1. Establishing the differences between consecutive expectations and experiences expressed in points.
2. Calculating the average difference in points in each of the analysed areas.
3. Using the Servqual method to calculate the total arithmetic measure of quality of the service examined.
The questionnaire consisted of 12 questions, 4 of which referred to general and sociodemographic issues. Stratified sampling was applied. The base for the strata were statistical data of the Main Statistics Office from the 2022 and 2023 census, related to the residence of the customers polled.
The survey was conducted on a group of 150 respondents, of whom, following the initial verification:
1) in England in 2022 – 118 (79,3%) respondents were qualified, while in 2023 the number of respondents was 124 (82%);
2) in Poland in 2022 – 136 respondents (91,3%) were qualified, while in 2023 – 135 respondents (89,3%) were qualified.
The detailed data on the groups of respondents are included in Table 3.
Table 3. The structure of respondents in England and Poland in the years 2022-2023 (in numbers\%)
| Criterion | England | Poland | ||||||
| Years | 2022 | 2023 | 2022 | 2023 | ||||
| No. of respondents | 118 | 124 | 136 | 135 | ||||
| Place of residence | Town | Village | Town | Village | Town | Village | Town | Village |
| 71 (59.7%) | 48 (40.3%) | 69 (56.1%) | 54 (43.9%) | 82 (59.9%) | 55 (40.1%) | 85 (63.4%) | 49 (36.6% | |
Source: Based on statistical data
4. Research and analysis of the assessment of insurance service quality in England
Insurance service quality in UK was examined by means of the 5-factor scale of the Servqual method, in which the factors (areas) are used to assess the level of insurance service quality in the opinion of customers of insurance institutions (Figure 1). For customers of UK, in 2023 the average result for all the areas of insurance service quality was at the level of (-2.15), in comparison with 2022, where the total average in all the quality areas was (-2.12), which means that customer preferences, influencing the increase in expectations in terms of insurance service provision, were not fully met, while the service quality level was unsatisfactory. The data acquired in during the first stage of the survey indicate a gap between expectations and experiences of customers of insurance institutions in all the dimensions of quality.

Figure 1. The level of insurance service quality in the opinion of customers of insurance institutions in England in 2022
Source: Based on statistical data
The above figure shows that of the above quality dimensions, an important attribute in direct contact with customers during the process of service provision is the tangible dimension of the activity of insurance institutions (-1,27). During the studied period, of all the studies areas, the lowest level showed such factors as: reaction to customer expectations, professionalism and confidence, and reliability. These areas of quality recorded the greatest differences, which lets us claim that the level of quality of insurance service provision is at a low level, while customer expectations towards the studied insurance are not fulfilled. Analysing statistical data in terms of the weighted average for each of the dimensions of insurance service quality and the weighted average of insurance service quality, it can be considered that the most important area for the respondents was the reaction to customer expectations, while the least important was the tangible area. Bearing in mind the importance of the analysed quality dimensions for the customers in UK in 2023, the total weighted average of the level of quality amounts to (-0,42), which indicates a low service quality and, consequently, the lack of fulfilment of customer expectations during the process of buying the service. Similar results were acquired in arithmetical average – in 2022 the highest weighted result: the reaction to customer expectations (-0,69) and the lowest result in the tangible area (-0,24), show the low level of service provision and also the dissatisfaction of customers with the insurance offered. The results of the analysis of the weighted average of the Servqual areas are presented in Figure 2.
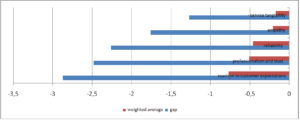
Figure 2. The level of quality of insurance services provided by insurance institutions in England in 2023, according to the measures: gap and weighted average
Source: Based on as in Figure 1
While assessing the insurance service quality in the opinions of customers, the Authors also included the criterion of place of residence of studied respondents (see: Table 1). The place of residence has a considerable impact on the accessibility of knowledge in terms of getting to know the insurance services provided by insurance institutions, thus, it contributes to the increase in customer awareness. In all the research groups, the arithmetic average reached a negative result. Moreover, the total result in all the areas of insurance service quality provided by insurance institutions was at a negative level, which is presented in Figure 3.
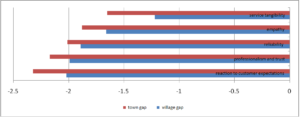
Figure 3. Assessment of insurance service quality among people residing in towns and villages in England in 2023
Source: Based on as in Figure 1
Analysing the group of respondents residing in towns in UK in 2023, the arithmetic average in all the studied areas was (-2,01), compared to 2022 when the average was (-2,00). The above results clearly confirm the opinions of respondents living in towns. In the opinions of the studied group of customers residing in towns in UK the following factors: professionalism and confidence, reaction to customer expectations, reliability and empathy were at the lowest level (in 2022).
In case of people residing in towns in UK, the average Servqual result in 2022 was (-2,00) and in 2023 was (-2,01), which is lower than the general average which reached in 2022 (-2,12) and in 2023
(-2,15). It shows that studied respondents feel the lack of satisfaction with the service bought and confirms the fact that the level of insurance service provision is at a low level and does not meet customer expectations.
Analysing the next group of respondents residing in villages in UK, the average difference of dissatisfaction between customer experiences and expectations in terms of offered insurance services was assessed in 2022 at the level of (-1,90), and in 2023 (-1,76), which shows that, like in case of people residing in towns, the level of insurance service offered brings unsatisfactory results. Assessing the process of service quality provision, the arithmetic average for both studied groups (town and village) in UK was (-2.00) in 2022 and in 2023 (-1,88). This situation indicates a growing dissatisfaction with the quality of offered services among the respondents residing in villages in UK. Comparing the two studied groups in the years 2022-2023, in terms of experience and expectations of the service provided, only in the area of “reliability” the results are similar. The greatest differences were recorded in the area of “service tangibility”.
In order to compare the results of the research conducted in UK, the Authors analysed and examined the customers using the service offer of insurance institutions in Poland. As indicated in Figure 4, in 2022 the average value of individual areas of quality reached (-2,15) while in 2023 the total result amounted to (-2,28).
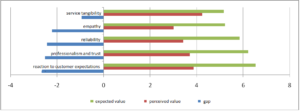
Figure 4. The level of insurance service quality in the opinion of customers of insurance institutions in Poland
Source: Based on as in Figure 1
The most favourable result of all the studied quality areas was achieved by the service tangibility
(-1,42) in 2022. It indicates that insurance institutions generally think that the tangible aspect of their activity (employees’ attractive appearance) is the main attribute in contacts with customers and it determines whether the insurance contract is executed. In the opinions of studied respondents, the lowest quality was shown in the following areas: reliability, professionalism and trust, and the reaction to customer expectations. In the listed areas, there were the greatest differences noted, which allows to claim that the level of insurance service quality is at a low level, and customer expectations are still not fulfilled.
The next stage of the research was to calculate the weighted average of the level of the insurance service quality in each of the studied areas. An important area for the studied respondents was the reaction to customer expectations, while the tangibility of the service was of slight significance. Bearing in mind the importance of studied dimensions, in 2023 the total average measure of insurance service quality amounted to (-0,49). To compare, the weighted average of the level of insurance service quality was (-0,54) in 2022, which indicates a low level of services, as well as the failure to meet expectations of potential customers (Figure 5).
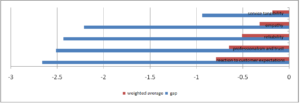
Figure 5. The level of quality of insurance services provided by insurance institutions in Poland in 2023, according to the measures: gap and weighted average
Source: Based on as in Figure 1
Studying the respondents in towns in Poland, the arithmetic average was (-2.96) in 2023, while in 2022 the average value in all the studied areas was (-1.99), which seems to be justified by a clear growth trend in the quality of service provided by insurance institutions (Figure 6).
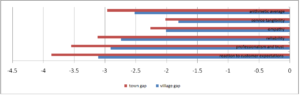
Figure 6. Assessment of insurance service quality among people residing in towns and villages in Poland in 2023
Source: Based on as in Figure 1
Among customers residing in towns in Poland region, the greatest differences were noted in the following areas: reliability, professionalism and trust and the reaction to customer expectations. The average result reached by people residing in towns in 2023 is higher than the general average result, which indicates that town residents feel more dissatisfied with the insurance studied and the level of the service provided is still at the low level, Studying the people residing in villages, the average difference between customer experiences and expectations in terms of the service provided was in 2022 (-2.53) and in 2023 (-2.52), which indicates that the quality of the service provided still brings unfavourable results. Assessing the process of service quality provision, the arithmetic average for both studied groups (town and village) in Poland was at the level of (-2.26) in 2022 and (-2.74) in 2023. This situation shows dissatisfaction of the respondents living in villages. Comparing both research groups in the years 2022-2023, in terms of experience and expectations of the service provided, only in the area of “empathy” and “reliability” the results are similar. The greatest differences were noticed in the area of “the reaction to customer expectations” and “professionalism and trust”.
5. Analysis of knowledge in studying the level of service quality on the basis of England and Poland
The growing customer awareness [Al-Rousan, Mohamed, 2010, pp. 202-208], the increasing possibilities of migration and the quickly-changing trends, cause that the key factor enabling to achieve success is meeting the expectations, adjusting the standards and quality of customer service to customer requirements. Building loyalty among customers and actions intended to reduce retention to keep the customer pose quite a challenge. Customers form their requirements on an ongoing basis, therefore, the information on their preferences should be regularly collected, then skilfully selected, as well as limited to the number under control and translated into technical parameters. This results from the acquired communications and knowledge about customer requirements. Knowledge is a structural element of modern institutions, which emphasises its key character in management processes [Bartnicki, 2000, s. 13-20]. The revision of knowledge about customer expectations enables to adjust the quality of service provided to the current standards. The overriding factor developing the level of knowledge and key competencies of customers in the processes of service quality provision is “professionalism and trust”, one of the key areas of Servqual which reflects the staff’s professional knowledge and their ability to create the atmosphere of trust and confidence among customers. This factor has been analysed against other studies areas, which is presented in Table 4.
Table 4. The analysis of knowledge in England and Poland in the years 2022-2023, including the area of “professionalism and trust”.
|
Servqual areas |
England | Poland | ||
| 2022 | 2023 | 2022 | 2023 | |
| Reaction to customer expectations | -2.87 | -2.92 | -2.96 | -2.66 |
| Professionalism and trust | -2.48 | -2.52 | -2.49 | -2.51 |
| Reliability | -2.26 | -2.22 | -2.31 | -2.43 |
| Empathy | -1.76 | -1.86 | -2.25 | -2.21 |
| Service tangibility | -1.27 | -1.26 | -1.42 | -0.94 |
Source: Based on the analyses conducted
On the basis of the conducted analysis of the level of insurance service quality among the customers of insurance institutions in UK and Poland, it can be concluded that customer expectations in terms of the insurance offer are insufficient, while the quality of service provision is unsatisfactory. The professionalism and trust factor is the second important in the process of service provision, which indicates a low level of customer satisfaction, as well as the low consciousness of the staff response to customer needs. In UK and Poland, the area of professionalism and trust does not show significant differences, although its slight growth trend may continue in the next years. It may be stated that in the areas in which there is easier access to new technologies, where the sector is dynamically developing, the value of services, as well as the level of knowledge, is reaching the level satisfying potential customers. The above results indicate a moderate difference between customer expectations and the perception of services offered in terms of individual quality areas. Thus, it may be stated that the existing discrepancies in the studied areas show a low level of satisfaction of customers with the quality of service provision. Insurance institutions, by taking action to improve insurance service quality, should possess basic knowledge about how to adjust customer expectations to the process of service quality implementation, which will allow for a positive perception of the service bought by customers.
Conclusion
The research conducted lets form the following conclusions:
1. The tangible aspect in the activity of insurance institutions is the main attribute in direct contacts with customers during the process of service provision. However, the greatest differences can be noted in such areas as: professionalism and trust, reaction to customer expectations and reliability, which indicates a low level of service quality in an insurance institution and the failure to adjust the service offer to basic customer needs.
2. In the studied provinces the average Servqual result and the weighted average in the studied areas were at a low level, which confirms that the level of insurance service provision is at a moderate level, which is connected with the failure to meet customer expectations.
3. Developing a positive image of an insurance institution in its environment without respecting customers’ rights is impossible. Failure to respect customer needs creates a negative opinion in the environment of the customer.
Bibliography
Alnaser F.M.I., Abd Ghani M., Rahi S. (2018), Service quality in Islamic banks: the role of PAKSERV model, customer satisfaction and customer loyalty, “Accounting”, 4(2).
Al-Rousan M., Mohamed B. (2010), Customer loyalty and the impacts of ser- vice quality: The case of five star hotels in Jordan, “International Journal of Business and Economic Sciences”, 2(3).
Boonlertvanich K. (2019), Service quality, satisfaction, trust, and loyalty: the moderating role of main-bank and wealth status, “International Journal of Bank Marketing”, 37(1).
Brandt R.D. (1987), A procedure for identifying value-enhancing service components using customer satisfaction survey data, [in:] Surprenant C. (Ed.), Add Value to Your Service, Chicago: American Marketing Association.
Hamrol A., Mantura W., (2008), Zarządzanie jakością. Teoria i praktyka, PWN, Warszawa.
Kant R., Jaiswal D. (2017), The impact of perceived service quality dimensions on customer satisfaction, “International Journal of Bank Marketing”, 35(3).
Parasuraman A., Zeithaml V.A., Berry L.L. (1991), Delivering Quality Service. Balancing Customer Perceptions and Expectations, New York: The Free Press.
Porter M E. (1990), The Competitive Advantage of Nations, London: MacMillan.
Przybytniowski J.W. (2019), Metody badania jakości usług w procesie zarządzania rynkiem ubezpieczeń majątkowych, Wydawnictwo Uniwersytetu Jana Kochanowskiegow Kielcach, Kielce.
Przybytniowski J.W. (2022), Konkurencyjność rynku dobrowolnych ubezpieczeń majątkowych jednostkowych w aspekcie doskonalenia jakości usług. Ujęcie teoretyczne i praktyczne, Uniwersytet Jana Kochanowskiego w Kielcach, Kielce.
Przybytniowski J.W. (2023), Voluntary Insurance in the Process of Service Quality Improvement, Wydawnictwo RYS, Poznań.
Zeithaml V.A., Berry L.L., Parasuraman A. (1988), Communication and control processes in the delivery of service quality, “Journal of Marketing”, 52(2).


 - https://www.economiaediritto.it/es/knowledge-and-quality-of-insurance-services-practical-approach/)